How It Works

FIVE MODULES

5 Different Modules Catering to Many Industries

Our modules are designed to integrate seamlessly with your production systems
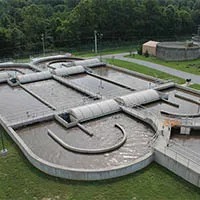
01. Anoxic + aerobic biological treatment

Conventional activated sludge and SBR systems. Monitors MLSS, SVI, F/M ratio, DO profile, sludge age, and nitrification/denitrification efficiency. Equipment adequacy. Predicts bulking and foam events, septic conditions, TAN / Nitrate escapes etc.
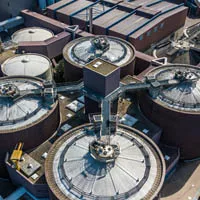
02. Anaerobic biological treatment

UASB, and CSTR systems. Tracks OLR, VFA/alkalinity ratio, biogas yield, pH stability, and volatile solids. Equipment adequacy. Predicts acidification, biomass loss etc.
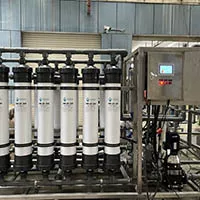
03. Ultrafiltration / MBR

Monitors trans-membrane pressure trends, flux performance, backwash & CIP effectiveness etc. Equipment adequacy. Predicts accelerated membrane fouling and optimises CIP scheduling.
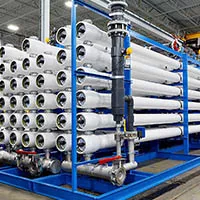
04. Reverse osmosis

Element pressure differential trending, normalised permeate flow and salt rejection. Early detection of scaling, fouling, and element failures before they escalate.
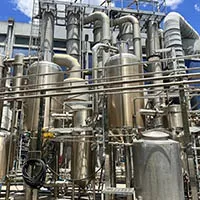
05. Multi-effect evaporation & dryers

Steam economy monitoring, evaporation rate vs design, TDS inlet/outlet tracking, Early detection of scaling and energy intensity per kg of water evaporated. Critical for ZLD plants.

7 Visual Insights That Provide a 360-degree View

Cost intelligence

Track energy, chemical usage, and cost per m³ treated — then act on the numbers that matter most. Also shows the cost saved.

KPI dashboard

Daily process performance indicators that tell you what your plant is doing — not just what sensors measure.

Dual parameter trend

Visualise correlations across two process parameters simultaneously to understand possible cause & effects.

Adequacy assessment

Compare actual operation against design intent daily. Know when your plant is being pushed beyond its design envelope.

Early warning

Drift detection, predict common process upsets before they become costly downtime events.

Prescribed actions

Once daily data is entered, Green Pulse™ generates clear instructions for the operator. Every action is acknowledged, completed, and logged automatically.

Process simulation

"What if the load increases 30%?" Answer the scenario before conditions change, that help you make informed decisions.

GREEN PULSE™ — THE JOURNEY

Start with intelligence. Scale to full autonomy. Same platform, deeper integration.

STAGE 1

Visibility & intelligence

Process intelligence layer above your existing SCADA

Standard Green Pulse™
📊 Visibility
  • KPI dashboard
  • Multi-parameter trends
  • Adequacy assessment
  • Cost intelligence
  • Design vs actual
🧠 Intelligence
  • Early warning
  • Prescribed actions
  • Process simulation
  • Operator response log
  • Audit-ready evidence

20–30%

Fewer unplanned upsets

15–25%

OPEX reduction

STAGE 2

Autonomous Plant Operation

Three inputs. One daily intelligence cycle. Automatic execution.

Green Pulse™ Autonomous

Input 1

📡
SCADA

Continuous sensor data

Input 2

👷
Field operator

Site observations

Input 3

🧪
Lab chemist

Daily analysis results

STEP 1
Green Pulse™ analyses all inputs
STEP 2
Instructions ready for review
STEP 3
Supervisor approves
STEP 4
PLC/SCADA executes

Once lab results arrive each day, Green Pulse™ combines them with SCADA data and field observations to generate a fresh set of operating instructions.

The supervisor reviews and approves — keeping a human decision in the loop before anything changes on the plant floor.

Once approved, the instructions are passed directly to PLC/SCADA — no manual re-entry, no delay, no operator interpretation required.

PLC/SCADA to execute the instructions

Every instruction, every approval, and every change made to the plant is logged automatically — the audit trail builds itself.

Siemens S7
Allen-Bradley
Schneider
ABB
Modbus TCP
OPC-UA

8–12%

Extra energy reduction

Zero

Manual re-entry errors

Upgrade When
Ready

Benefits

Tangible

  • 20–30% fewer unplanned upsets
  • 5–15% energy optimisation
  • Reduce excess chemical use, lower sludge disposal
  • 15–25% saving in operation cost

Intangible

  • Reduced compliance anxiety
  • Faster root-cause diagnosis
  • Institutionalised process knowledge
  • Less dependence on “star operators
  • Stronger ESG and audit posture

Outcome

  • Owners get visibility
  • Operators get clarity
  • Auditors get evidence